Multifamily Living Multiplies

by Brad Houle, CFA Executive Vice President

Demand for commercial real estate from investors has been robust for the past few years. In a world of low interest rates, the relative yield advantage of owning commercial real estate is attractive to investors. In addition, trophy commercial properties in gateway cities like New York and San Francisco are seen as a “store-of-value” to foreign investors. When international investors are faced with a volatile home currency or an unstable government, the thought of owning a landmark building in an American city is a relatively prudent investment. As a result, real estate transactions in coastal cities have occurred at price levels that imply a very meager return for the buyer.

While most categories of commercial real estate have performed well, one of the most robust has been apartment buildings. Home prices have rebounded sharply since the Great Recession, particularly in the “cool” cities that millennials prefer to call home. One would think that the millennial generation is the demographic driving new household formation and should be in their prime first-time home buying years. However, a cultural shift has taken place whereby millennials are waiting longer to get married, start families and often prefer to rent for a number of reasons.

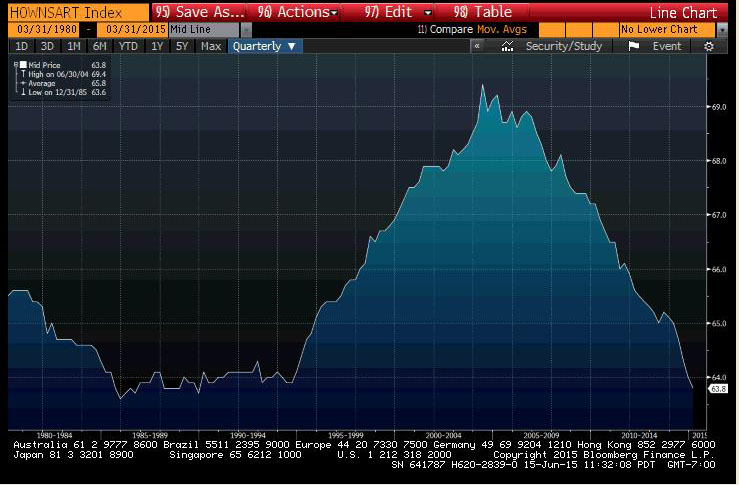
According to the U.S. Census Bureau, home ownership as a percentage of households has declined nationally from nearly 70 percent in 2004 and 2005 to 63.8 percent in 2015. A one-percentage-point change in home ownership rates equates to 1.3 million households, according to Bloomberg data. Lending requirements for first-time home building have been tightened dramatically since the financial crisis and the 20-percent down payment requirement disqualifies many millennial prospective homebuyers.

Home Ownership as a Percentage of Total Households Chart
 Source: Bloomberg 

According to Bloomberg, apartment construction nationally has been rising since 2009. Apartment construction permits, a leading indicator of multifamily construction, was at an all-time high of 557,000 units in May. Permits last approached this level in June 2008.

Broadly speaking, real estate development moves in cycles. Whether it’s the unsold condos following the 2009 financial crisis or the now ubiquitous “selfie stick,” we have seen firsthand that whatever the hot trend happens to be is, it has the potential to … cool down.

Greekspeak

This week there continued to be directionless news flow regarding the continued debt crisis in Greece. While it is impossible to determine what the outcome may be, one thing is certain: The market has a high level of Greece fatigue. Investors are weary of the issue and it appears that even the correspondents on CNBC are tired of reporting on it. We are closely monitoring the debt of neighboring southern European nations for any sign of contagion and thus far, the crisis does not seem to be spreading. July 20 is now viewed as a critical day, according to Bloomberg, as Greece owes the European Central Bank (ECB) 3.5 billion euros on that day. If there is a failure to pay, this would put Greece on the way to getting the boot by the EU. Interestingly, Greece will possibly delay payment to the International Monetary Fund (IMF) this month with no real consequences as liquidity will not be cut off to Greek banks. Evidently, not paying back the IMF is something akin to not paying back your in-laws with the only consequence being an awkward Thanksgiving dinner. The impact of not paying back the ECB is similar to not paying back the guy you borrowed money from at the racetrack.

In addition, the Federal Open Market Committee minutes were released this week. Parsing every word of the Fed minutes revealed that interest rates may rise in September and December of this year. This quote possibly has been the most over-analyzed and highly anticipated Fed rate hike of all time. Ultimately, this is good news: The Fed thinks the economy is robust enough that they need to tap the brakes to keep it from getting overheated.

Our Takeaways for the Week

  • Expect interest rates to make small movements upward in the fall
  • The multifamily housing market is robust and is likely to peak this year

Disclosures

Stuck With You

by Ralph Cole, CFA Executive Vice President of Research

Stuck With You

We all know too much of a good thing is no longer a good thing: that has been the case with interest rates in recent years. Coming out of the financial crisis, banks needed lower interest rates so they could repair their battered balance sheets. Short-term rates came down even faster than long-term rates and allowed banks to pay virtually nothing on deposits and make loans at a substantial profit. As long-term rates have come down, banks have had to lower what they charge for loans, thus reducing their profit margins (otherwise known as net interest margins). For the last couple of years, banks have been hoping for higher rates. Thus far this quarter they have received their wish and we can see that regional bank stock prices have responded well.

Slide1

Source: FactSet

The correlation between U.S. 10-year Treasury yields and the regional bank index has been remarkable. The theory is that as long-term rates rise banks will be able to charge more for the loans than they make. They will also get higher returns on bond investments that they offer. These improved profit margins will help bank earnings. Much like the relationship between oil and gasoline prices at the pump, banks will be slow to raise interest on deposits and much quicker to increase what they charge on loans. We expect rates to continue to move higher throughout the rest of the year.

Every Little Thing Is Going to be Alright

In a year when the Fed is expected to raise interest rates every piece of economic data is parsed and picked apart. This week it was retail sales and consumer comfort. Retail sales were strong, whereas consumer comfort came in weaker than expected … So let’s just step back for a moment.

Employment gains have resumed their 200,000+ trajectory from 2014. Wage growth is finally starting to flow through the economy. Consumers and corporations continue to benefit from generationally low interest rates. We believe the consumer and the economy are on solid footing and that bodes well for whenever the Fed starts raising rates - be it June, September or December. We caution all not to worry too much about the daily economic numbers or the daily movements in the stock market.

 Takeaways for the week:

  • Banks are a beneficiary of higher long-term interest rates
  • "Main Street" is finally feeling the positive effects of this economic expansion

Disclosures

You're Hired!

Shawn-00397_cmykby Shawn Narancich, CFAExecutive Vice President of Research

Green Shoots

 A week chocked full of economic insight concluded with a bang, as a strong jobs report for the month of May provided more assurance to investors that a contraction in first quarter GDP is likely to be transitory. The U.S. economy created a net 280,000 nonfarm jobs last month, nearly a third better than what Wall Street was expecting. Good news on the jobs front was widespread among various industries and accompanied by more evidence that wage gains are firming. After being hamstrung by the West Coast ports strike, an exceedingly strong dollar and another harsh conclusion to winter, the U.S. economy now appears to be gathering speed.

In its attempt to determine the right time to begin raising interest rates, the Fed will triangulate today’s bullish job report with additional evidence of gathering momentum in manufacturing released earlier this week, that coming in the form of an ISM report showing that activity has picked up for the first time since last fall. As well, construction spending perked up in April and previous months’ activity was revised upward. Finally, Yellen & Co. would observe that U.S. light vehicle sales posted another strong number in May, rising to a seasonally adjusted annual rate of 17.8 million vehicles sold, a 10-year high. The plurality of this week’s data reveals an economy no longer in need of unconventional monetary policy and leads us to believe that the Fed will achieve lift-off from zero interest rate policy this fall, most likely in September.

Raise Rates in 2015 … Mais Non?

As investors were digesting the good news domestically, the International Monetary Fund was busy revising down its estimate of how fast the U.S. economy will grow this year. In an unusual move, Managing Director Christine Lagarde urged the Fed to hold off on raising rates this year, arguing that doing so would lead to an even stronger dollar and threaten the rate of expansion globally. The French may be opinionated, but even her admonition is likely to fall on deaf ears. We have said repeatedly that when the Fed raises rates, it will be for the right reasons, and the data we are beginning to see affirm for us that the U.S. economy is rebounding in the second quarter. Like last year, we see a second quarter reversal carrying through with strength into the second half of 2015.

Markets on the Move

Although the IMF might not be convinced, bond investors have responded in dramatic fashion, selling longer dated issues in mass and sending benchmark U.S. rates to their highest levels of the year. Equities in the financial sector are doing the opposite, rallying in anticipating of higher rates boosting banks’ net interest margins. In anticipation of rising rates, we recently increased our weighting to financials, while further trimming our exposure to a consumer discretionary sector that appears closer to full value.

Our Takeaways from the Week

  •  The U.S. economy appears to be perking up, solidifying expectations for Fed action later this year
  •  The bond market is responding, with rates rising to their highest levels of the year

Disclosures


Wired and Connected

by Jason Norris, CFAExecutive Vice President of Research

For technology junkies, the Re/code conference in Southern California is one of the highlights of the year. It is a broad mix of public and private companies speaking on innovation today and what the future holds -- from automobiles and wireless to media and culture.

One of the most popular segments of the conference is Mary Meeker’s annual presentation of internet trends. Meeker is a partner at venture firm Kleiner Perkins; however, her thrust into the spotlight came about 20 years ago when she was an internet analyst for Morgan Stanley. The key point to her 190+ page slide deck was that the internet is still in its very early stages and mobile is becoming more of a dominant aspect of the web. While the consumer and businesses have been pushing the internet, there are several other areas of the economy where opportunities are still great. Government, education and healthcare are just a few examples of sectors that have not yet fully leveraged the internet.

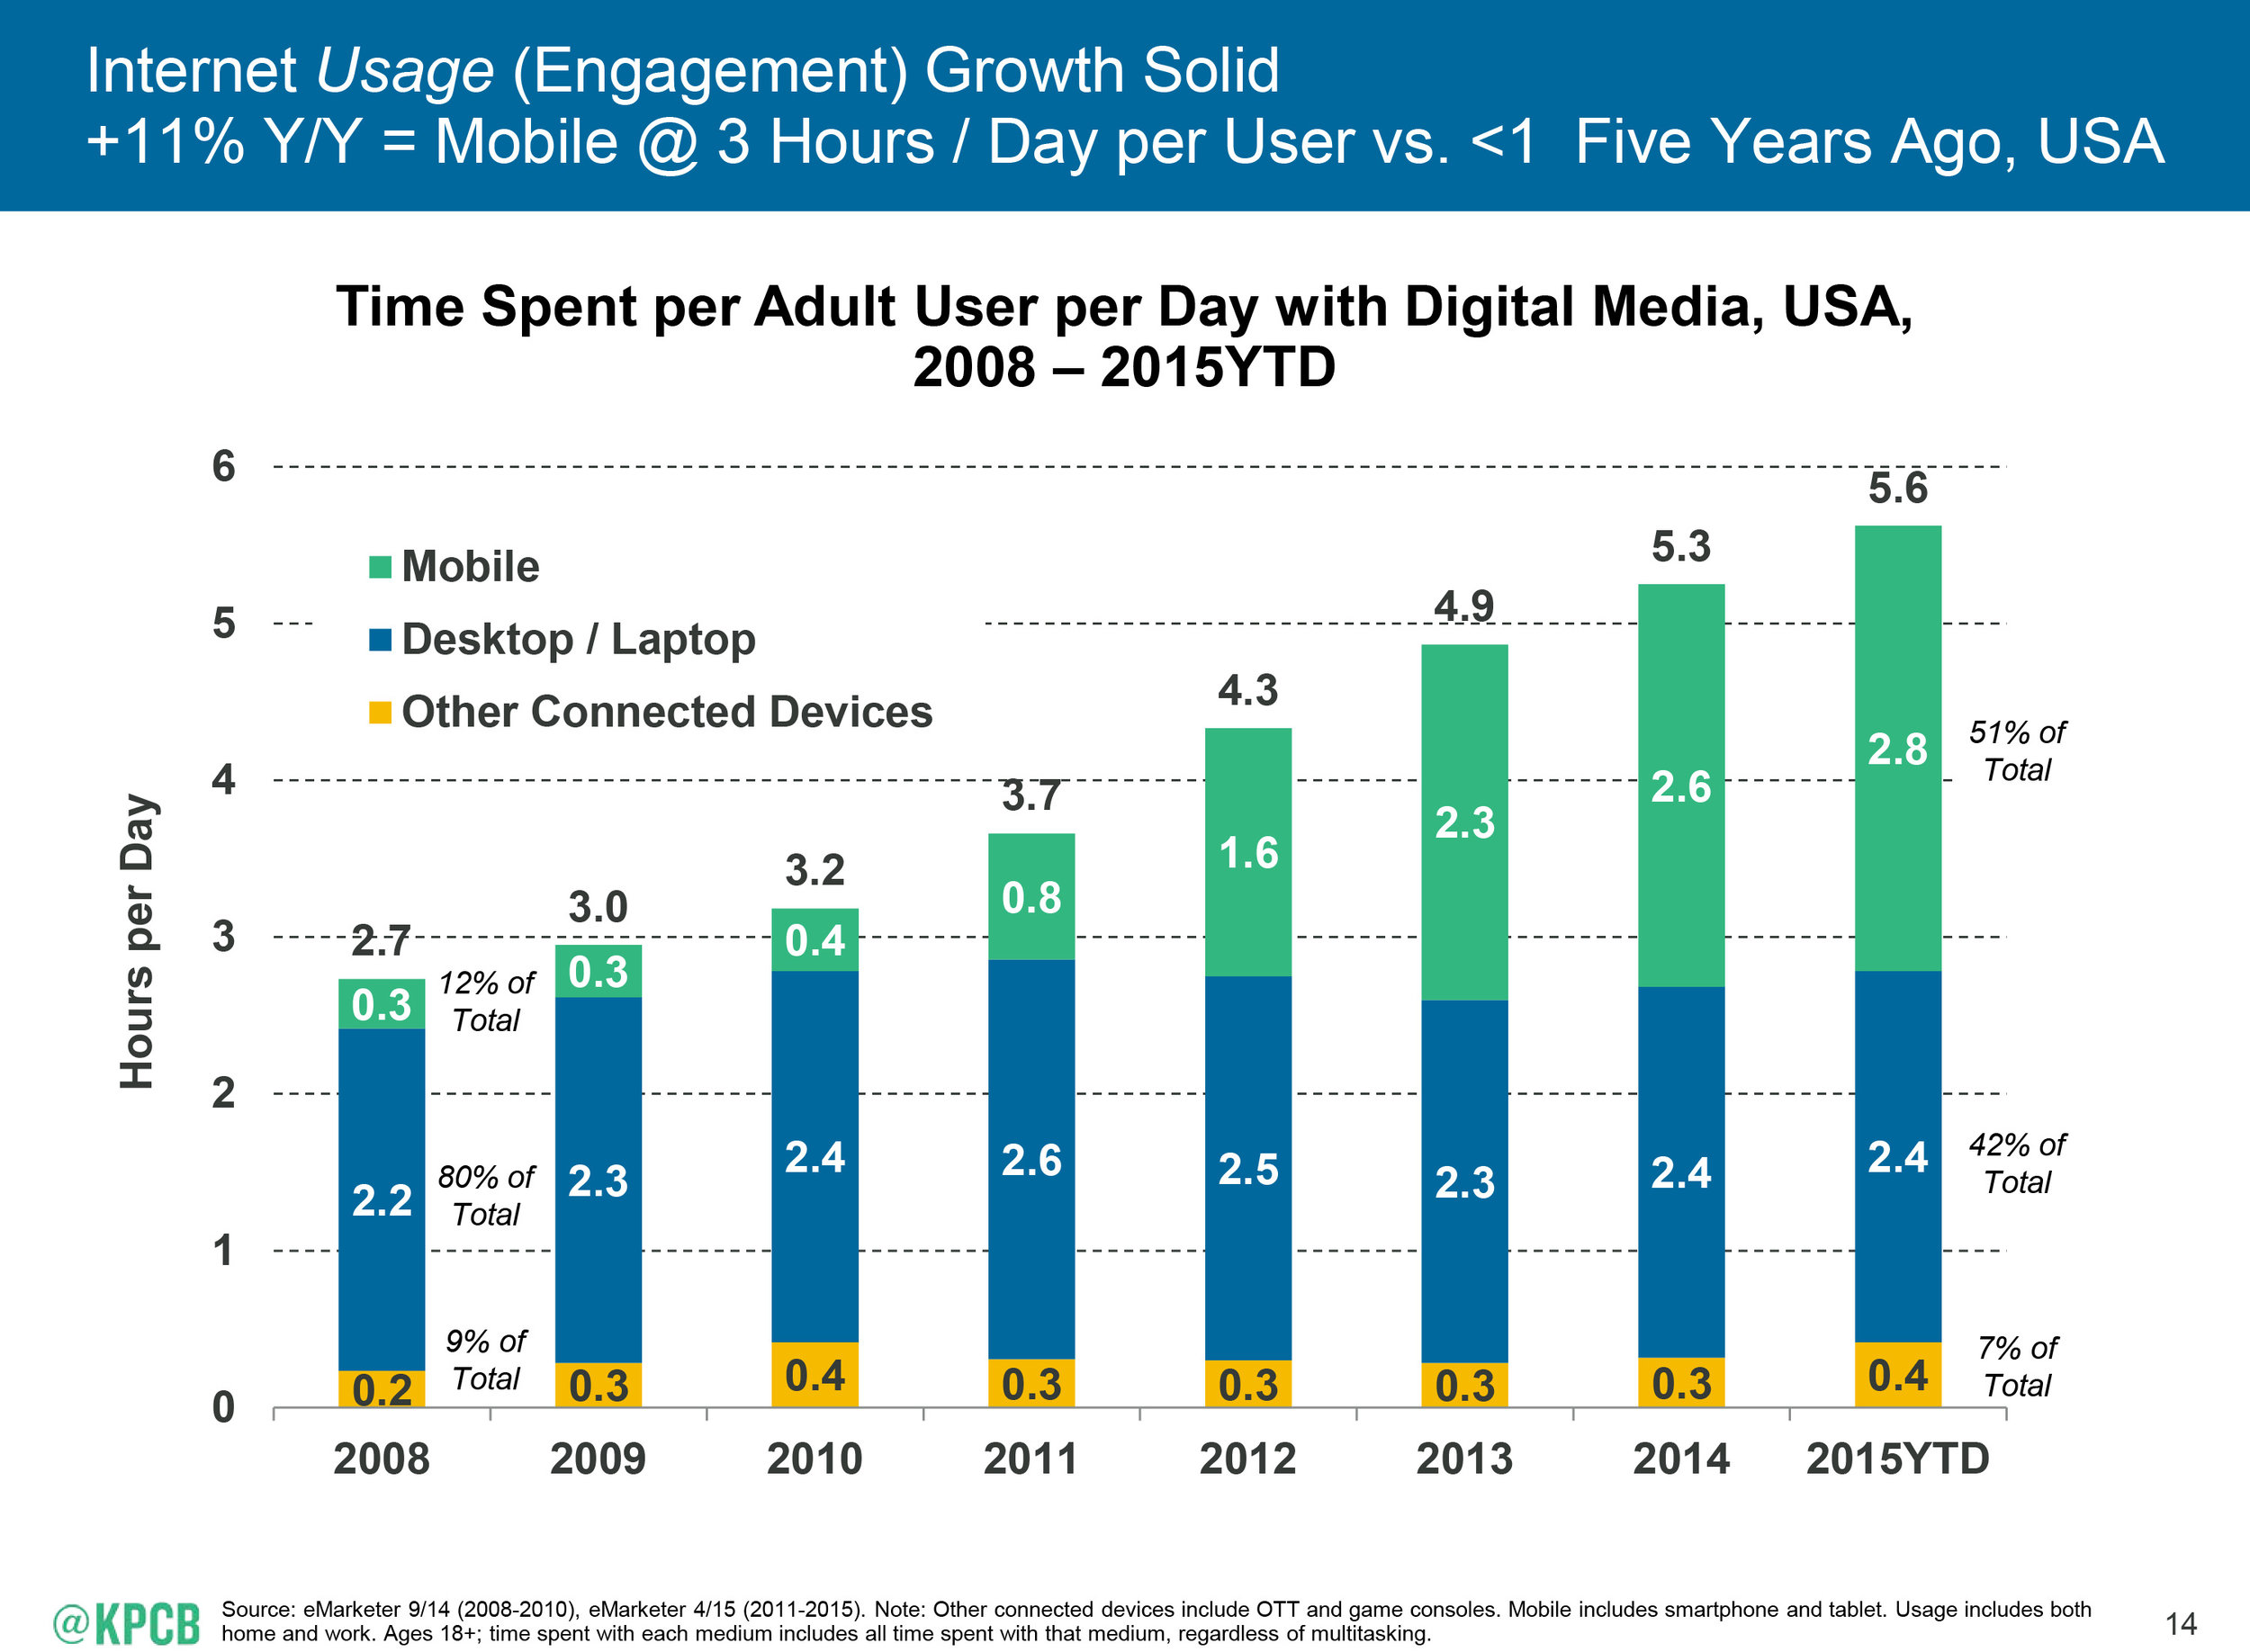
As users, traffic, and transactions increase online – security becomes more of a focus. What has been a common news event of late, there are breaches at various institutions that can put both individuals and those entities at risk. The IRS unfortunately is the most recent institution to be significantly impacted. As more people connect to mobile devices, security and encryption are even more essentials. The chart below highlights time spent with digital media on different devices.

Internet_Trends_2015-14

Accessing digital media continues to grow at a double-digit rates and the growth is primary coming from mobile. This growth in connectivity globally continues to benefit companies such as Apple, Samsung and Avago.

Increased transactions as well as a growth in private information shared digitally, specifically wirelessly, does increase the need for better security, as well as the opportunity for companies to analyze consumer behavior and offer personalized deals. These trends have resulted in chief information officers (CIOs) to forecast security and analytics spending to continue to increase as a percentage of information technology (IT) spending. Morgan Stanley released a survey earlier this week highlighting a 210 bps increase in the growth of network security spending in 2015 (12.8 percent up from 10.7 percent). To put in perspective, overall IT spending usually grows in the low-to-mid-single digits. Some beneficiaries of this trend would be Cisco, Checkpoint and Palo Alto Networks.

Watch What You Do

As consumer utilize more wireless devices and with the most recent launch of the Apple Watch, some legal issues become a bit fuzzy. In several states, it is against the law to use your wireless handset while driving. What if you are using your watch? This was the case in Quebec earlier this month where a watch owner was fined $120 for operating his watch while driving. As devices become more integrated, especially in cars, safety regulators are going to have a tough time keeping up.

Our Takeaways for the Week

  • Mobile is becoming the dominant means of interent access
  • Cybersecurity will be a theme for years to come

Disclosures

Changing Liquidity in the Fixed Income Markets

by Brad Houle, CFA Executive Vice President

The bond market is a dealer market with no central exchange. This means that all bond trades are over-the-counter trades whereby market participants trade amongst themselves. By contrast, stocks are traded in a continuous auction market where an investor can get the market price of a stock instantly by seeing where it is trading on the various electronic and physical exchanges. Bond pricing can be more esoteric, particularly for more exotic securities such as some mortgage-backed bonds or high-yield bonds.

The 2008 financial crisis was sparked by speculative mortgage-backed securities which started to fail when homeowners stopped paying their mortgages. Part of the issue was the fact that it was difficult to nearly impossible to value these securities and there was no liquidity for these bonds. The government often regulates in response to the last crisis and this situation is an example of backward looking regulation. As part of the reactive financial market regulation that came out of the financial crisis was that banks are now required to have greater regulatory capital. On the surface this seems like a good idea: banks are required to hold more "safe" assets on their balance sheets like U.S. Treasury bonds to cushion for inevitable bumps in the road. The unintended consequence of this change has made it difficult for large banks to effectively trade fixed income securities. It used to be good business for Wall Street banks to trade bonds with customers. Banks would make a market in bonds and would use their balance sheet to provide liquidity to customers. With onerous capital requirements this business has become difficult and unprofitable for participants. The bond market has gotten much bigger since the financial crisis and much less liquid.

According to the Wall Street Journal, since the 2008 financial crisis the U.S. Corporate bond market has doubled in size to $4.5 trillion dollars. In addition, outstanding U.S. Treasury Bonds trading volumes have fallen 10 percent since 2005 while the size of the market has tripled.

The implication for this change is volatility in the bond market will probably be higher going forward. We have yet to have a real test of bond market liquidity since financial crisis. When interest rates start to climb we will see how resilient the market is when short-term investors in bonds all try to squeeze out the same small door at the same time.

The good news for Ferguson Wellman clients is we largely use individual bonds for clients. This is important because an investor that owns an individual bond can wait out the pricing volatility because at maturity you will get your money back. Participating in panic selling into a volatile or potentially illiquid market is completely voluntary. In the past, we have been able to be opportunistic buyers of bonds sold into illiquid markets. One case in point was the mini-crisis in the municipal bond market when an analyst named Meredith Whitney unwisely used her fifteen minutes of fame on the television program 60 Minutes to incorrectly predict massive defaults in the municipal bond market.

Another silver lining to this potential situation is an advance in technology that could improve liquidity in the fixed income markets. The leading edge of fixed income trading is an electronic bond trading platform that has the potential to revolutionize bond trading. Rather than use a bond dealer intermediary to trade bonds, this platform allows firms like Ferguson Wellman to trade directly with other investment management firms. This concept is in its infancy and Ferguson Wellman is adopting this technology where it can benefit our clients’ portfolios. We are optimistic that wide adoption of this technology can benefit all fixed income investors.

Our Takeaway for the Week

  • A lack of liquidity in the bond market may cause volatility in bond prices to be elevated in the future. Owning individual bonds can allow an investor to ride out any potential storms. Also, we think that an eventual broader adoption of electronic bond trading technology will eventually make markets function more smoothly.

Disclosures

Spinning Wheel

by Ralph Cole, CFA Executive Vice President of Research

Spinning Wheel

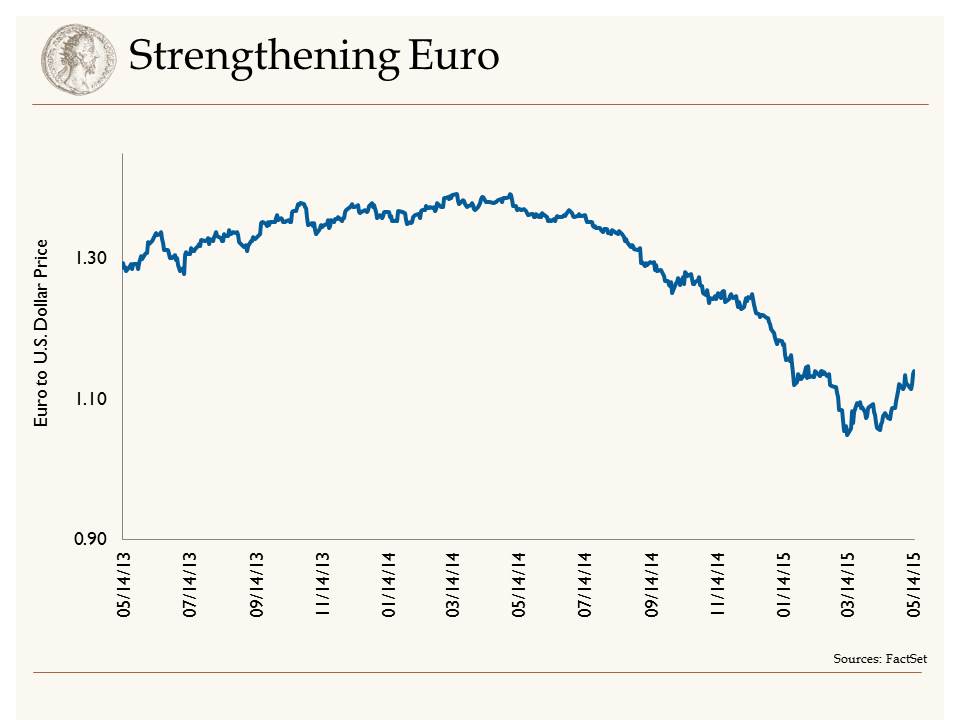
The strong dollar has been a headwind for S&P earnings so far this year. However, that headwind appears to be dissipating. Having traded at $1.40 less than a year ago, by last month the Euro had plunged to $1.05. The Euro's 25 percent devaluation has been a positive development for European economies. Paired with quantitative easing, this has led to a rally in European equity markets.

Slide1

As confidence has started to build in the Eurozone, we have seen economic growth starting to accelerate. In fact, first quarter GDP in the Eurozone was 1.6 percent, which compares favorably to the meager .2 percent reported  in the U.S. for the first quarter. This change at the margin, with Euro growth outpacing U.S. growth, has led to a strengthening of the Euro relative to the U.S. dollar. As Shawn Narancich stated in our March 13 blog, "the dollar was due for a break after such a parabolic run." Since mid-March, the Euro has strengthened 8.5 percent relative to its U.S. counterpart. We view this moderation in dollar strength as a positive for U.S. multi-national companies, and we also see it as a healthy indicator for the capital markets. We still believe that the dollar will strengthen against the Euro as the year moves along, but it will be gradual.

Finally

Along with a rally in the Euro, we have seen a rally in interest rates since the end of January. The U.S. 10-year bond yield bottomed at 1.64 percent in January; today it stands at 2.23 percent. Not only have U.S. bond yields risen over that time period, but so have yields in Europe. After bottoming at .08 percent, the German 10-year bund now stands at a .70 percent yield. We have long maintained that higher global yields would result in higher rates here in the U.S. and we believe yields are finally starting to discount expectations of stronger global growth in coming quarters.

 Takeaways for the week:

  • The dollar has taken a pause against the Euro, and we view this as healthy for the global economy
  • Higher yields are reflecting higher growth prospects in the second half of 2015

Disclosures

Krys-Rusoff Appointed to Metro Exposition and Recreation Committee

Deidra Krys-Rusoff, senior vice president and portfolio manager,  has been appointed to the Metro Exposition and Recreation Commission (MERC). While new to the MERC, Krys-Rusoff is not new to Metro, having joined the Oregon Zoo Bond Citizens Oversight Committee in 2010, serving as vice chair and chair. MERC works to protect the public investment in three of Metro’s visitor venues: Oregon Convention Center, Portland Expo Center and Portland 5’s Centers for the Arts. Scott Robinson, Metro’s deputy chief operating officer, said Krys-Rusoff was an obvious choice for the position. “Deidra comes from the financial sector. She’s involved in bond markets, which has really helped our oversight committee. She is able to communicate the technical information to the rest of the committee in a way they can understand.”

“Deidra’s commitment to serve our community is very admirable and consistent with the value she brings to our clients and company every day. We are proud of her accomplishments and leadership,” said Jim Rudd, principal and chief executive officer of Ferguson Wellman.


Belaboring Labor

Shawn-00397_cmykby Shawn Narancich, CFAExecutive Vice President of Research

Working for a Living

Investors unnerved by disappointing economic data of late breathed a sigh of relief with the April jobs report, which showed that nonfarm payrolls rebounded to a monthly rate of 223,000 last month. Unemployment dropped again and now stands at 5.4 percent, a rate not too far from the Fed’s definition of the full employment rate of unemployment (somewhere just north of 5 percent.) A “goldilocks” report of sorts that’s neither too hot nor too cold, the April payroll release supports the notion that the Yellen & Co. will likely begin the rate tightening process this fall. As policymakers and investors debate how tight labor markets actually are against a backdrop where the labor force participation rate hovers near its lowest level since the late 1970s, we are increasingly attuned to reported wage rates and the broader employment cost index (ECI). While wage gains remain muted at 2.2 percent in April, the ECI of 2.6 percent released last week demonstrated a notable uptick. When juxtaposed against anecdotal evidence of wage gains at fast food restaurants and retailers, our best guess is that the worm has turned with regard to employment costs this cycle. Because labor accounts for the predominant cost of doing business, the near-zero inflation rates we’ve seen of late appear likely to begin rising. When combined with the recent rebound in oil prices, headline inflation probably rises closer to the Fed’s 2 percent target by year-end.

Spring Forward

In contrast to the encouraging labor report, investors were greeted by a report showing that productivity of the U.S. labor force declined for the second consecutive quarter. While somewhat obscure, the statistic shines a light on the U.S. economy’s weak start to the year. By marrying employment and output statistics, the report tells us that the U.S. economy produced less per each hour worked in the first quarter. The reason productivity is such an important statistic is because when it’s combined with employment costs, it generates what we call unit labor costs. As alluded to above, sustained increases in the cost of labor are a key signpost for inflation, particularly when they translate into rising costs of production on a per unit basis. Just as importantly, unit labor costs determine how profitable companies are and the overall standard of living enjoyed by workers. Another tough winter combined with disruptions from the west coast ports strike put a damper on the U.S. economy in the first quarter, but we believe that an improving labor market, rising disposable incomes, and higher capital spending will engender a rebound of sorts in the second quarter. Commensurately, we would expect productivity to return to positive territory.

Exceeding Expectations

First quarter earnings season is just about finished and, once again, U.S. companies have done a remarkable job of under promising and over delivering.  Compared with expectations of a low single-digit decline in first quarter profits, corporate America is instead delivering earnings that should end up being marginally above levels of a year ago. In particular, while dramatically lower oil prices caused red ink to flow on the income statements of many energy companies, the damage was ameliorated by better downstream refining and marketing results and the quick pace with which oil and gas producers have right-sized their cost structure.

Our Takeaways from the Week

  • A solid April employment report bodes well for better economic times ahead
  • Another encouraging earnings season is just about finished


Taking a Bigger Bite Out of the Apple

by Jason Norris, CFAExecutive Vice President of Research

Apple reported earnings earlier this week. Due to recent strength in the stock, investors took profits. Specifically, sales grew 27 percent year-over-year, driven by 55 percent growth in iPhone revenues. This resulted in profit growth of 40 percent. These growth rates are very rare for companies with annual revenues over $200 billion and a market capitalizations (the share price multiplied by total number of shares outstanding) in excess of $700 billion. Therefore, sustainability does frequently come up.

On a similar note, with Apple’s market capitalization of $725 billion, it is now considered the highest valued company in the world. With that value, it is now 4 percent of the S&P 500, the most common equity benchmark. When active investors attempt to beat their benchmark, knowing some of the major constituents is critical for investment managers. In the case of Apple, if an investor believes that Apple is going to perform better than the S&P 500, they now have to allocate more than 4 percent of their portfolio to that stock. If they do not and Apple were to perform better than the S&P 500, investment managers will not keep up.

From a diversification standpoint, most investment managers are hesitant to hold positions greater than 4 percent, thus would now be underweight Apple. Since Apple is a very large component of the large-cap equity benchmarks, we recently reviewed the 10 largest actively managed core and growth mutual funds. For core managers trying to beat the S&P 500 when Apple is a 4 percent position, eight of 10 are underweight, and the other two are equal. When looking at growth managers when Apple is 7 percent of the benchmark (i.e., Russell 1000 Growth), nine managers are underweight and only one is equal. This data revealed that Apple is extremely underowned among the world’s largest mutual funds. If those funds were to move to an equal weight position relative to the benchmark, we would see over $29 billion worth of buying, which is roughly 235 million shares. Since we have a positive view on Apple, we believe this data is also positive.

Just like clockwork, this time of year the financial press will be prognosticating about the old adage, “sell in May and go away.” This comes to the forefront since equity markets often experience lackluster performance in the spring and summer months. However, it does not necessarily mean that investors lose money. Since 1978, from May to September, stocks median return was 3 percent, lagging the performance of equities from September to May. This has resulted in a median performance of 11 percent. We believe this doesn’t signal “a sell” since there are still positive returns to be had, just more potential volatility. The negative returns captured in the chart below are the result of two poor months, July and September.

Chart_5_1_15

Source: FactSet

Our Takeaways from the Week

o   Apple continues to be an "underowned" stock which may provide outside buying power adding support to the name

o   While summer is often a results in lackluster equity period for performance, we don’t think investors should trade based on the calendar

Disclosures

Ferguson Wellman Capital Management Ranked 32 on Forbes Magazine’s Top 100 Wealth Managers List

PORTLAND, Ore. – May 1, 2015 – Ferguson Wellman Capital Management was named by Forbes Magazine as a top wealth management firm. This is the third year that Ferguson Wellman was represented on the Forbes list. Specifically, Forbes named Ferguson Wellman 32nd on the “Top 100 Wealth Managers” list. The data for the rankings is provided by RIA Database and is based on the total discretionary assets under management by year-end 2014. Ferguson Wellman is the only firm to be named in Oregon and one of three firms listed that is located in the Pacific Northwest.

“We appreciate this recognition from Forbes,” said Jim Rudd, principal and chief executive officer. “We are fortunate to experience annual growth in assets and new clients, and we appreciate the work of everyone in our company who is focused on seeking investment excellence and earning lifelong relationships.”

Founded in 1975, Ferguson Wellman Capital Management is a privately owned registered investment adviser that serves over 700 clients with assets starting at $3 million. The firm works with individuals and institutions in 36 states with a concentration of those clients in the West. Ferguson Wellman manages $4.3 billion comprising union and corporate retirement plans; endowments and foundations; and separately managed accounts for individuals and families. In 2013, West Bearing Investments was established, a division of Ferguson Wellman, that serves clients with assets starting at $750,000. All company information listed above reflects 3/31/15 data.

###

Methodology From Forbes: Data for the Top Wealth Managers list is compiled by our partners at RIA Database. Candidate firms qualify based on both quantitative and qualitative criteria. This year we expanded the list to 100 firms, and ranked them by assets under management for year-end 2014, reported as of March 31, 2015. Members of the list must manage at least 50% of their assets on behalf of retail clients, can not run a broker-dealer (they can be affiliated with one), can not be a bank (trust companies are permitted), and must be performing wealth management services. Firms can not have had any regulatory, civil or criminal disclosures. The list looks beyond exclusively fee-only advisors because the RIA industry is evolving to incorporate more hybrid models as more representatives break away from broker-dealer models but carry along old business that includes some commission-based work.

http://www.RIADatabase.com.

“Forbes Top 100 Wealth Managers 2015” http://www.forbes.com/sites/steveschaefer/2015/05/01/top-wealth-managers-2015-investing-advice/

Note: Clicking on this link will take you to a third-party website. The information provided by this site is not endorsed or guaranteed by Ferguson Wellman. Clients should contact their portfolio manager with any questions about this topic. 

Moving Out

by Brad Houle, CFA Executive Vice President

In the month of March, sales of previously owned homes increased to 6.1 percent. Sales of 5.19 million homes is the highest level we’ve seen since 2013. At the height of the housing bubble prior to the great recession in 2008, existing home sales were as high as 7 million a month in the summer of 2005.

Following the 2008 crisis, existing home sales dropped as low as 3.5 million in June of 2010. While we will probably not see a return to 7 million homes sale in a month, the housing market is most certainly recovering. New home sales have followed a similar pattern, peaking prior to the crisis at 1.25 million in the summer of 2005 and now are averaging around 500,000 new homes per month.

Home sales are driven by new household formation as well as job growth. New household formation is defined as  individuals who are between the ages of 25 and 35 moving out of their parents’ basements to live on their own. While many people in the millennial generation prefer to rent, some are becoming first-time home buyers which is driving entry-level housing sales. Payroll growth has been robust with the unemployment rate dropping from 10 percent post-financial crisis to only 5.5 percent. There is a strong correlation with home sales and payroll growth as people become more secure in their employment … home sales follow.

Housing_Chart

Housing supply is low relative to historical rates with less than 5 months of supply. During the downturn, inventory ballooned to more than 12 months of supply. A lack of supply is driving prices higher in many markets also fueled by low interest rates.

Anecdotally there are tales of home buyer bidding wars in tight markets and other frenzied 2006 housing bubble behavior. According to the S&P/Case Shiller Home Price Index, home prices in the U.S. have only recovered 54 percent of the value lost since 2006. The most important difference between housing activity now and prior to the downturn is that lending requirements are much more stringent than in the past. Gone are the days of stated income loans, also known as liar loans, and no-money-down subprime lending. Lending requirements now require actual income and asset verification as well as a 20 percent  down payment.

Our Takeaway for the Week

o   Despite positive housing news, we do not think this industry is heading into bubble territory

Disclosures

Movin' On Up

by Ralph Cole, CFA Executive Vice President of Research

Movin’ On Up

U.S. oil production is finally starting to fall. After unrelenting production increases for the past several years, weekly oil production numbers have begun to decrease. In response to falling oil prices rig counts have dropped dramatically here in the U.S. The number of rigs operating in the U.S. is down 53 percent from the peak reached last year. This change has helped to drive West Texas Intermediate (WTI) oil prices back up to the mid-$50 range from a low of $43 just one month ago.

We would be remiss if we didn’t point out that the global demand for oil continues to rise. This is the other half of the supply-demand relationship that ultimately determines oil prices. The International Energy Agency (IEA) increased their expectations for global oil demand an additional 90,000 barrels per day, bringing their 2015 projected increase of daily oil demand to 1.1 million barrels per day.

No Expectations

Earnings season is a fickle, nuanced and fascinating time of year for portfolio managers. After each quarter of business, companies report their earnings and sales to analysts and the public. Companies guide investors to what they think earnings will be in future quarters. When a management team realizes that they are going to materially beat or miss their earnings guidance they announce it before the scheduled earnings release date which is called a pre-announcement. The pre-announcement ratio is calculated by taking the number of negative pre-announcements and dividing it by the number of positive pre-announcements by company. Strategas Research Partners calculates that the ratio is 6.2 to 1 this quarter, versus a long-term average of 2.73.  This is actually a very positive contrary indicator for the market. Companies have lowered expectations so much, that they usually end up beating the lowered bar. While this is only a short-term indicator, it may help explain positive stock movements on relatively weak earnings.

movin on up image

 Takeaways for the week:

  • Oil companies have drastically cut the number of oil rigs operating in the U.S., which will help improve the supply demand balance for crude oil in the coming months
  • The stronger dollar and lower energy prices have led companies to pre-announce lower earnings for the first quarter of 2015

Disclosures

Faulkner Receives Award from Portland Business Journal

Faulkner Receives Award from Portland Business Journal

Mary Faulkner, senior vice president of branding and communications, was honored by Portland Business Journal as a 2015 Woman of Influence Orchid Award Winner. 

Market Letter First Quarter 2015

Please click here to find our Market Letter First Quarter 2015. We hope you find our economic insights interesting and informative.  

Mastering Expectations

Shawn-00397_cmykby Shawn Narancich, CFAExecutive Vice President of Research

 A Tradition Unlike Any Other

 As another Masters golf tourney gets underway in Augusta, Georgia this week, investors are beginning to process the first reports of a dawning earnings season; as well, they have been jolted by a strong dose of deal news this week totaling well over $100 billion in announced acquisitions. Whether this flurry of activity heralds meaningfully more late-cycle deal making remains to be seen, but low interest rates as well as low oil prices support the rationale for energy deals like Royal Dutch’s $70 billion purchase of British energy company BG Group. Speculation is rife that rivals Exxon and Chevron could be compelled to do the same. Although buying another European producer might make more sense now in light of the strong dollar, we view neither of these integrated oil producers as likely to attempt a large deal for a major peer. More likely are deals for smaller independent U.S. producers with quality acreage in key Texas shale plays like the Permian Basin and the Eagle Ford.

Ready, Fire, Aim

As Royal Dutch jockeys for position in Big Oil, energy investors attempting to divine the low in prices for this cycle were forced to confront the not-so-shocking news out of Iran that that their “supreme leader” Khamenei is calling for the immediate lifting of economic sanctions in return for concessions limiting the country’s nuclear program. As well, he apparently disdains the idea of nuclear inspections that would confirm the country’s compliance with key provisions of the agreement reached in Switzerland last week. All of which leads us to conclude that predictions about a wave of new Iranian oil buffeting the markets any time soon is premature. From our perspective, the likelihood of reaching a final nuclear agreement with Iran looks increasingly unlikely.

Skating to Where the Puck Will Be

Geopolitics aside, we believe oil prices have bottomed and that markets will tighten meaningfully in the second half of this year, pushing prices closer to the marginal cost of production estimated to be somewhere between $75 and $100/barrel. From an investment perspective, we are overweight the energy sector and favor upstream producers and the service companies that enable their production as the two groups most likely to benefit from rising oil prices.

And They’re Off!

Alcoa marked the unofficial beginning of first quarter reporting season by announcing better-than-expected earnings on healthy growth in aluminum demand from both the aerospace sector as well as the emerging market in autos. Unfortunately for shareholders, the results met with a thud by investors who drove the stock down 3 percent on fears that aluminum prices will succumb to excess supply from China, the world’s largest producer. Next week will mark the first full week of earnings, with the money center banks and a few select industrial and healthcare companies on tap to deliver their numbers. In contrast to depressed energy results amid low oil prices, we expect earnings growth from sectors like healthcare and technology.

Our Takeaways from the Week

  • Deal making is being stimulated by low oil prices, low interest rates and a strong dollar
  • Investors are beginning to turn their attention to first quarter earnings


Pushin' Forward Back

by Jason Norris, CFA Executive Vice President of Research

The official start of earnings season kicks off next week and it looks like earnings for the broad market are going to be negative five percent. There are two main culprits for this. First, the recent strength in the U.S. dollar took large multinational companies by surprise, which resulted in major revenue and earnings revisions lower in 2015. The S&P 500, a standard large cap equity benchmark, has approximately 35-40 percent of its constituent’s revenues outside the United States. Therefore, a major strengthening of the U.S. dollar (see the below chart) results in U.S. goods being more expensive.

Chart

For example, if $1.00 = 0.80 Euro, then if a U.S. manufacturer were selling a $100 item in Europe, customers there would be spending 80 Euros. With the recent strengthening, $1.00 is now the equivalent of 0.95 Euros, thus that same $100 item would cost 95 Euros. This is a major price increase and headwind for U.S. exporters. We saw this instance with companies like Microsoft, Caterpillar, and more. On the other hand, the weakening Euro makes those products cheaper in the U.S. Thus, we believe European exporters should stand to benefit from this, and will be a catalyst to stimulating growth in Europe. As such, we recently increased our exposure to the International markets.

Down In a Hole

The other culprit for the major negative revisions for earnings is the reduction in the price of oil. In the past six months, the price of oil has been cut in half which is having a dramatic effect on the earnings in the oil patch. The year-over-year change in energy earnings in the first quarter is a negative 65 percent. Excluding this area of the market, earnings are forecasted to grow by three percent.

Outshined

These two attributes are setting up for a tough year for headline growth numbers. Earnings growth estimates have declined from seven to two percent for 2015. However, if you exclude Energy, earnings growth should come in closer to nine percent. Our belief is the overall economy is improving and the consumer will be the main beneficiary. While recent consumer spending data has been mixed, we are seeing an improving trend, particularly in consumer confidence. Therefore, continued low interest rates and energy prices throughout 2015 are a tax cut for consumers, and with a tightening labor market, we expect to see an increase in wages. This is all setting up to be a good year for “Main Street.”

Our Takeaways for the Week: 

  • The strong dollar and low oil prices are a headwind for US earnings growth
  • Main Street will be the winner in 2015

Disclosures

2015 Q1 Market Letter

2015 Q1 Market Letter

Volatility aside, 2015 is playing out much the way we anticipated. Europe’s central bank has graduated from talking about quantitative easing (QE) to actually delivering on it, and with $1.1 trillion of bond purchases planned for the next 18 months, markets

Connecting The Dots

by Brad Houle, CFA Executive Vice President

Last week's Fed announcement had something for everyone. The Fed removed the word "patient" from its forecast for increasing interest rates. This is an acknowledgement that the economic recovery is well underway and the strong employment data month-after-month is a confirmation of this fact. Taken in a vacuum, this change in the Fed’s message could be construed as being "hawkish" meaning that the Fed is in a hurry to raise interest rates to keep the economy from overheating. However, the Fed also dropped its own interest rate forecast which could be construed as being "dovish" meaning that the Fed is reluctant to raise interest rates. As a result, there was a strong rally in both the bond and stock markets which is what we mean by something for everyone.

The Fed's interest rate forecast or "Dot Plot" is a relatively new construct from the Fed. There has been a concerted effort to communicate more openly with the markets by the Fed. This endeavor was successful in the Bernanke-era Fed and has also been continued by the Yellen-era Fed. It is pejoratively called "open mouth policy” because what the Fed communicates to the market is ultimately as important as what the Fed actually does.

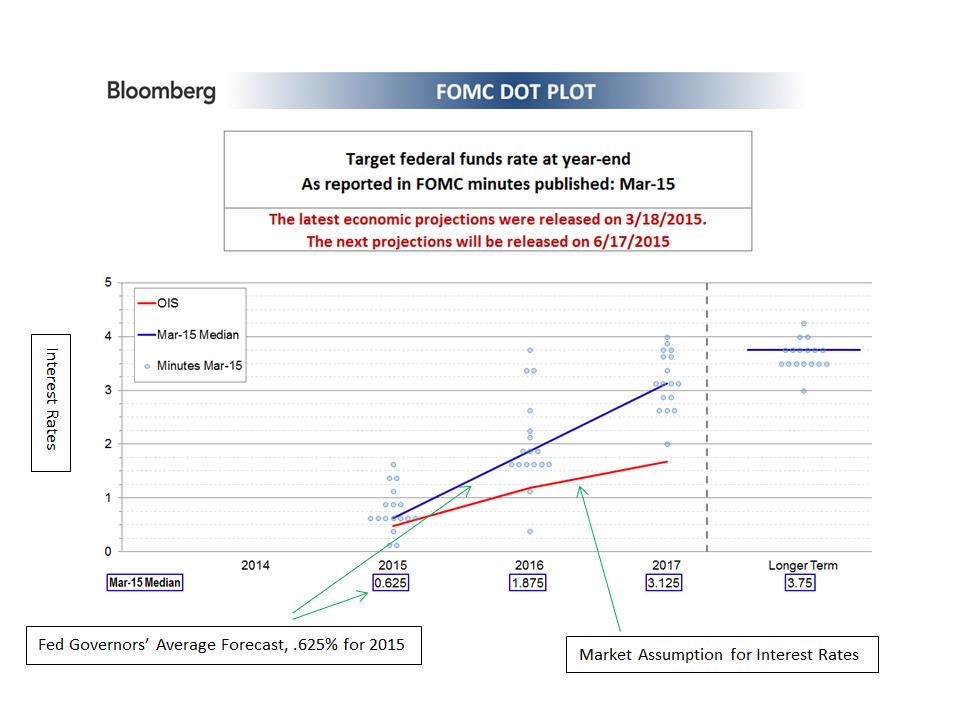
In the “Dot Plot” each Fed Governor posts their interest rate forecast on a chart which is then released with the minutes of the Fed meetings. Each dot is only one person’s opinion; however, the dots when taken in context, gives investors an idea of what the Fed Governors are thinking. Ultimately, these individuals have the ability to influence when short-term interest rates actually rise. Historically, when short-term interest rates have risen, longer-term interest rates have also climbed. Our research partner Bloomberg has done a good job illustrating what the Fed is trying to communicate with the "Dot Plot."

Blog chart

The blue line above represents an average of the Fed Governor’s forecasts for the next three years. These forecasts range from .625 percent for short-term interest rates by the end of 2015 to 3.125 percent by the end of 2017. The red line depicts what the market is discounting for interest rates over the next three years. The market discounts a number of different circumstances - both the Fed raising interest rates and not raising interest rates. This Federal Reserve forecast is assuming that rates are going to be raised. There has been much hand-wringing over when the Fed will actually act. Ultimately, when the Fed actually raises rates is unimportant. The important thing is that the economic growth is robust enough that rates should rise to keep the economy from overheating.

Our Takeaway for the Week:

  • We think short-term interest rates are going to rise. This is good news in that the economy is healthy enough that the Fed should act to keep it from overheating

Disclosures

Come Together

by Ralph Cole, CFA Executive Vice President of Research

Late last year we had a great chart that showed the Fed’s own expectations for tightening were ahead of the markets’ expectations for Fed tightening. We explained that as those two outlooks moved toward one another there would be volatility. On this past Wednesday, we experienced the positive aspect of that volatility.

Fed officials concluded two days of meetings in Washington and issued a statement regarding the economy and interest rates. While many were focused on the language used by the Fed, we were more focused on the Fed governors’ expectations for short-term interest rates in the coming year and the lowering of the theoretical “full employment rate”.

As part of Federal Open Market Committee (FOMC) meetings, each of the Fed Governors plots what they expect the Fed Funds rate to be at the end of 2015, 2016 and 2017. This chart has been referred to as “The Dot Chart”. The median expectations of the governors for Fed Funds at the end of 2015 actually came down from 1.125 percent to .625 percent. This means that the Fed Governors still expect to raise rates in 2015 (which we expect as well), but just not as quickly as they previously expected. This is more in line with what the market was hoping for; thus it was met with both a stock and bond market rally.

Untold Stories

Unemployment has been one of the most controversial topics of this economic expansion. The unemployment rate steadily moved down from 10 percent in 2009 to 5.5 percent in February. This rapid decline stood at odds with what many people felt they were experiencing in their own lives, and what was anecdotally highlighted in the media as well. What makes this more than a theoretical conversation is the unemployment rate’s effect on wages.

The most recent Federal Reserve study on employment came to the conclusion that the “full employment rate” for the U.S. economy was approximately 5.4 percent. The belief being that at 5.4 percent unemployment wages would start to rise or even accelerate. In the Fed’s statement today, they lowered the theoretical full employment rate for the United States to between 5.0 percent and 5.2 percent. Because we have not seen wages increase up to this point, they concluded that a lower level of employment would be needed to begin to pressure wages higher. This conclusion fits perfectly with the expectations of Fed Governors that the Fed Funds rate would not be increasing as much as previously expected. One company of note is Target, which announced this Thursday that they would be increasing wages for employees to at least $9/hour in April.

Takeaways for the Week:

  • The Fed continues to signal that they will be raising rates later this year, but at a pace that agrees with the markets’ assessment of our economic situation
  • Future Fed meetings and communications will cause increased volatility in the market

Disclosures