by Marc Fovinci, CFA Principal
Today, the Bureau of Labor Statistics published its monthly employment statistics. Especially with the presidential election in full swing, the state of the jobs market is on people’s minds. Let’s step back from today’s numbers and look at the employment over this economic cycle.
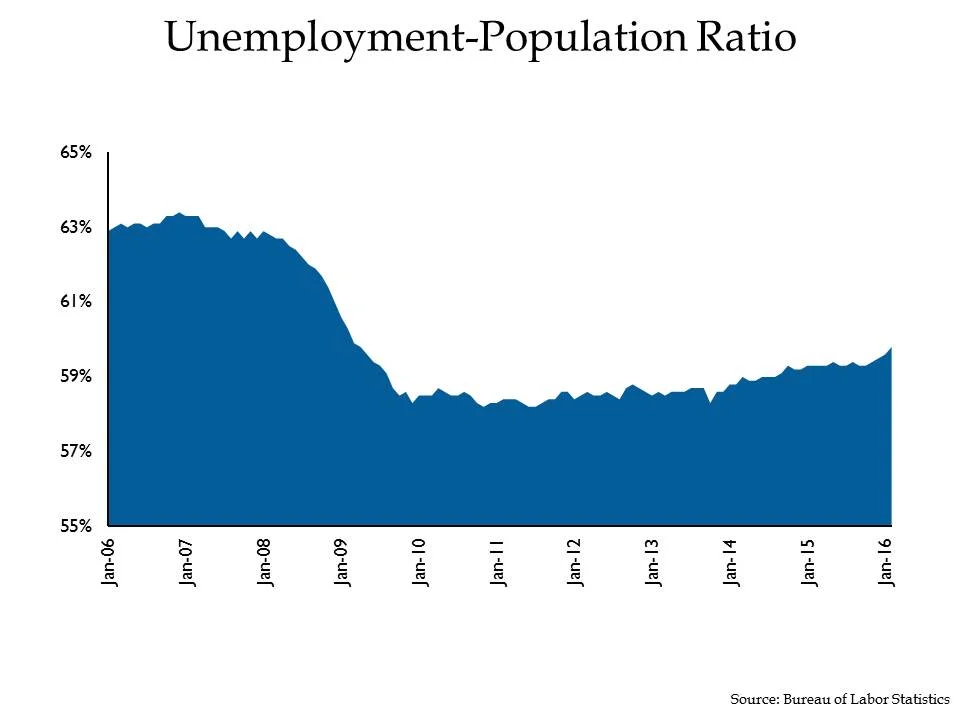
Here is a graph of the Employment-Population Ratio, the number of people employed divided by the total population:
While there has been a bit of a surge in the ratio in the last few months, it still remains well below the last expansion’s peak, 3.6 percent below to be precise. The two main explanations of the stubbornness of this gap are (1) people discouraged from looking for work and (2) baby boomers retiring or being essentially forced into early retirement.
You can make a similar inference from the unemployment rate graphed here:
This is the number of people looking for work divided by the size of the labor force. The U-3 number is the one most often quoted in the news, thus the “Headline” nickname in its title. It currently stands at 5.0 percent. The U-6 number includes everyone in U-3 plus people who want to work but are not actively looking for work. This is a measure of the discouraged workers, the people “waiting on the sidelines” to come into the job market when they feel it is strong enough. U-6 is just barely below its peak in the last recession. Obviously, the job market still has quite a ways to go to be as strong as in the peak of the last expansion.
Now here is the number of jobs, Nonfarm Payrolls:
Interestingly, the growth in jobs is in service industries. Goods producing (manufacturing) has shrunk. Government has been steady (except for a very slight blip in 2010 for the census workers). Specifically, here is the change in jobs for different periods:
Change in Nonfarm Payrolls in Millions
There are 5.1 million more jobs than the peak of the last expansion and 13.8 million more than the bottom of the recession. What mostly stands out here is the first line: a 7.7 million gain in service jobs and a 2.3 million loss in manufacturing. The Bureau of Labor Statistics breaks this down into detail, and the biggest gains since the last peak in employment are:
Healthcare and Social Assistance 3.0 million
Professional and Business Services 2.0 million
Leisure and Hospitality 1.9 million
The last recession and the current expansion are certainly marked by a decline in manufacturing employment and an expansion in service industry employment. This shift has displaced workers and necessitated more education and retraining of the workforce.
Our Takeaways for the Week:
- Bottom line, employment recovery is not complete and has been uneven in its distribution as the economy continues its transition towards less manufacturing and more services.


